Choropleth Maps
A choropleth map is a map that uses shading or color to impart some information about regions on the map. One common quantitative choropleth is a population density map.
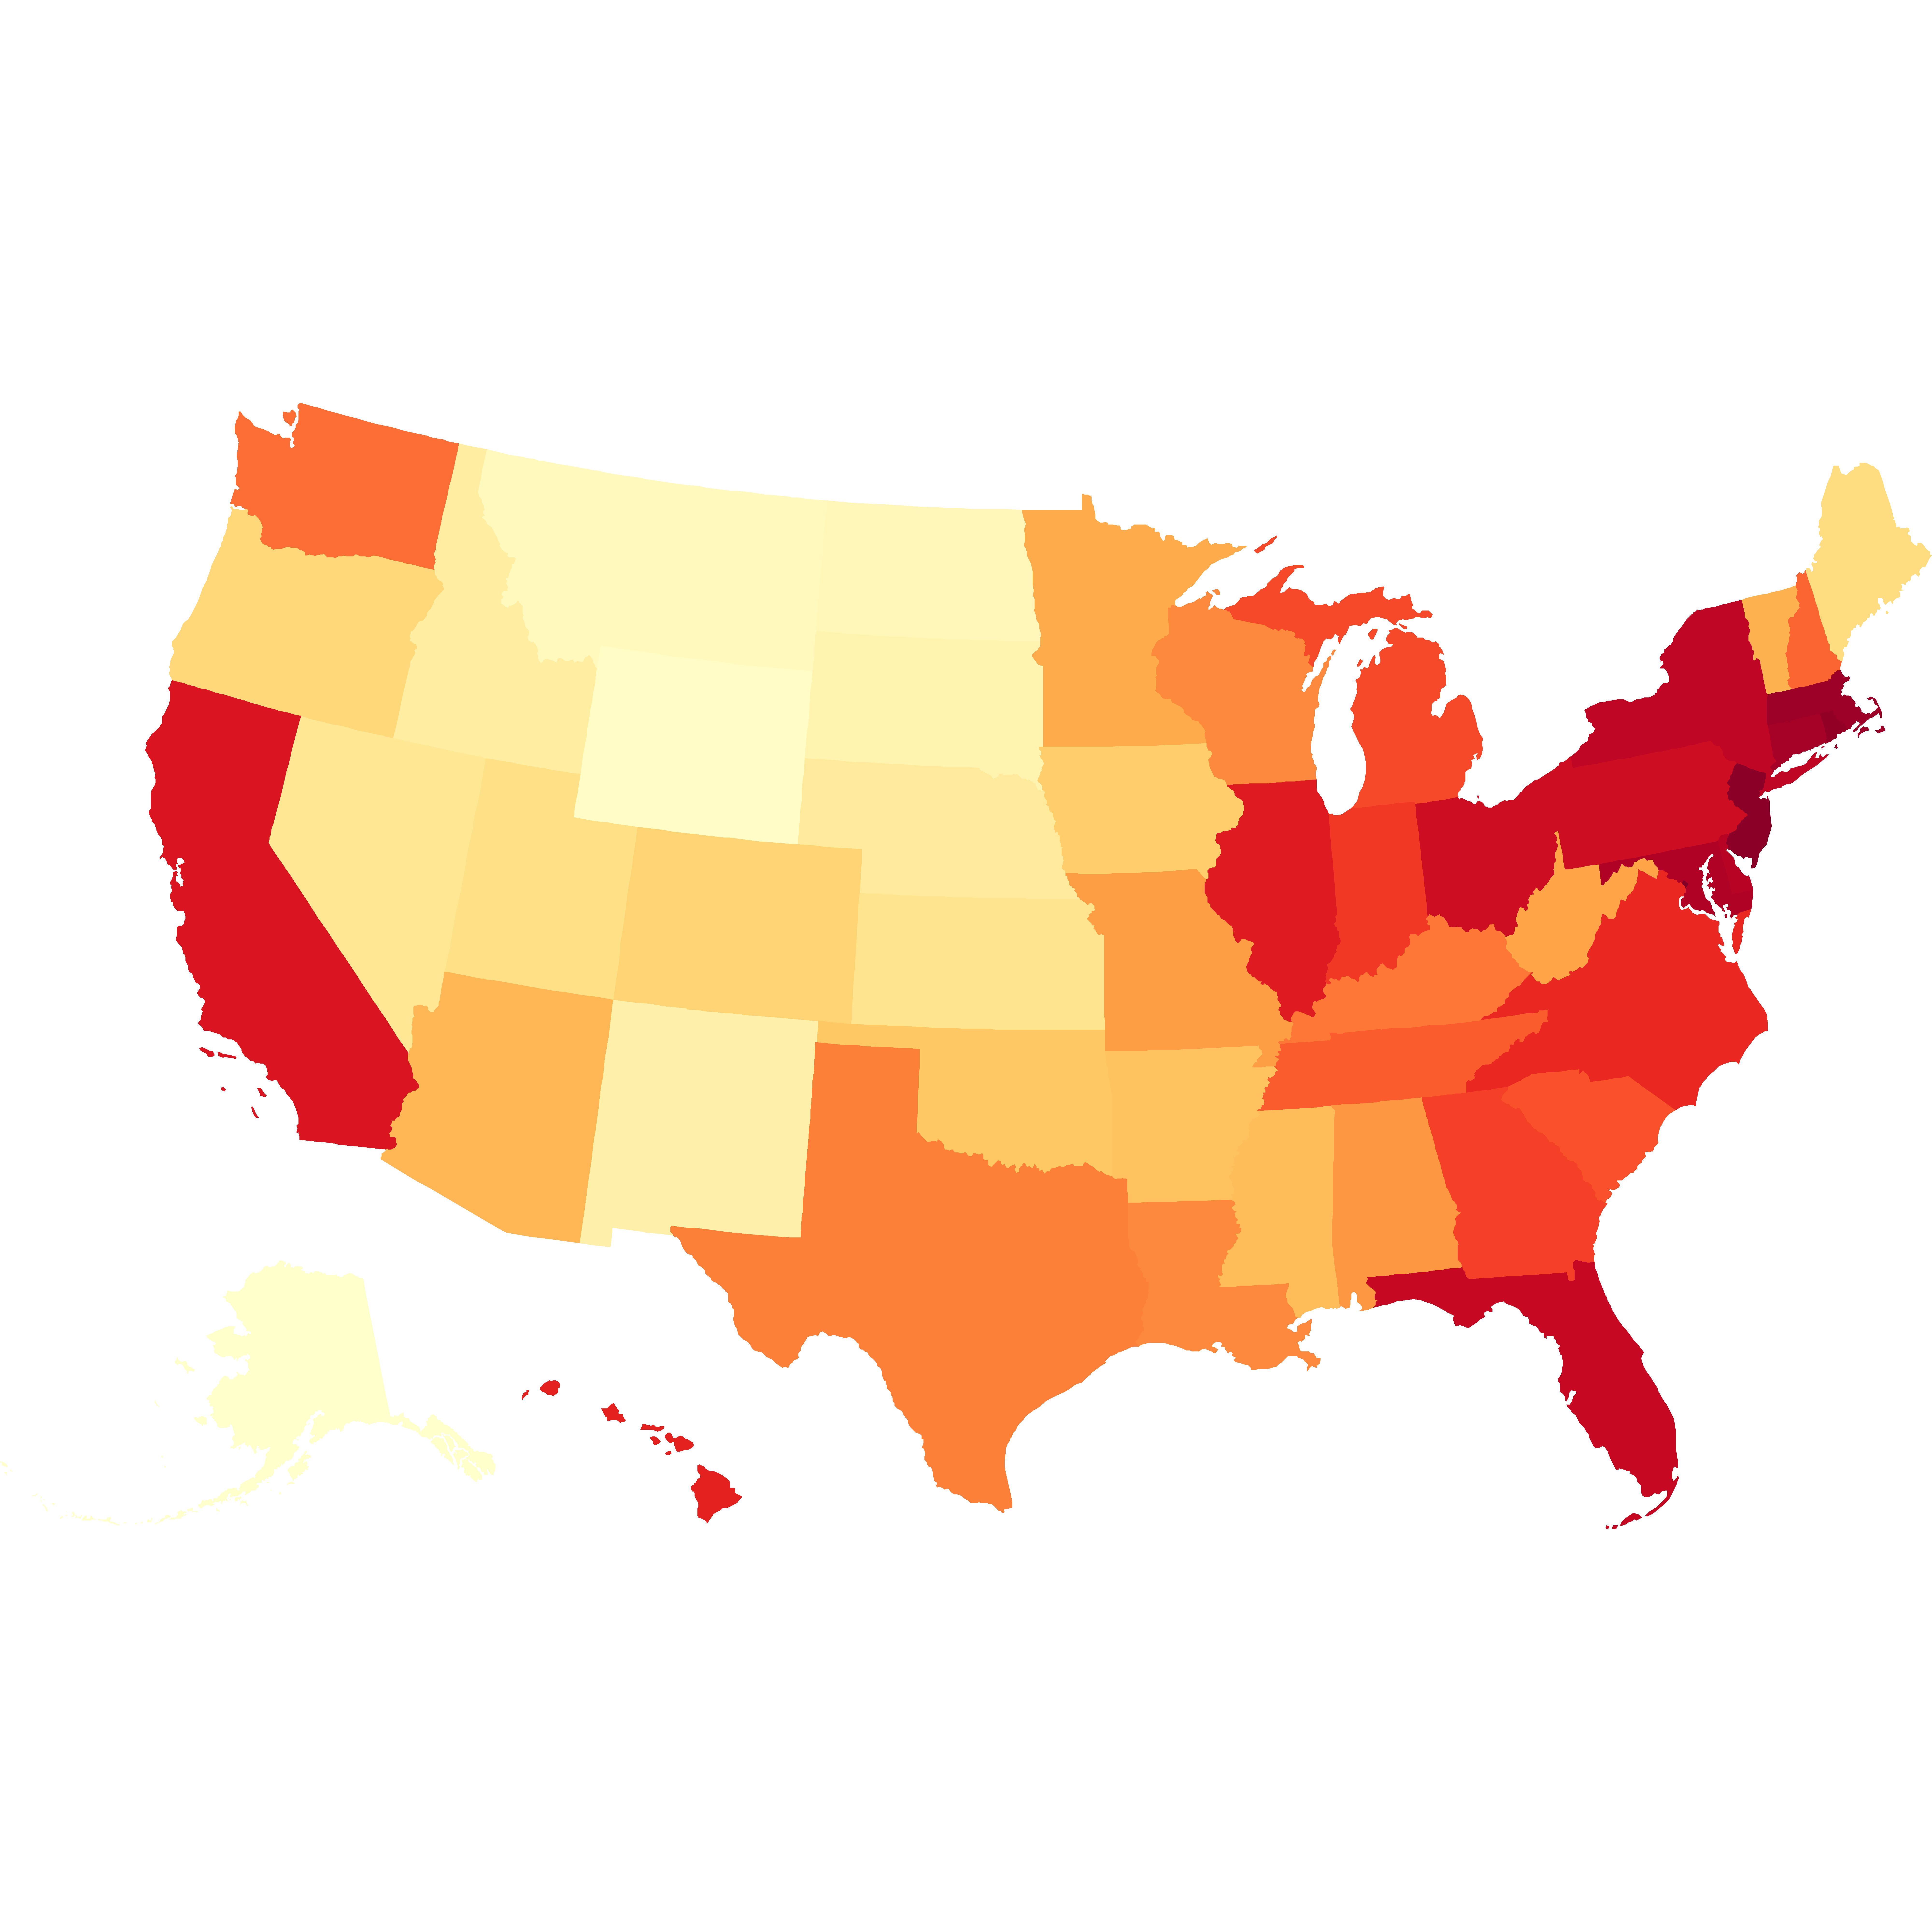
ndjson-join 'd.GEO_ID' 'd.properties.AFFGEOID' \
  data/census/population/state-population-2019.ndjson data/census/cb_2017_us_state_20m/cb_2017_us_state_20m.0.ndjson \
  | ndjson-map 'd[1].properties.FULL_NAME=d[0].NAME, d[1].properties.POPULATION = +d[0].POP, d[1]' \
  > data/census/states_with_population.1.ndjson
mkgeo-render-choropleth data/census/states_with_population.1.ndjson \
  -f "d.properties.POPULATION/(d.properties.ALAND*3.861e-7)" \
  -o output/choropleth/state-pop-density
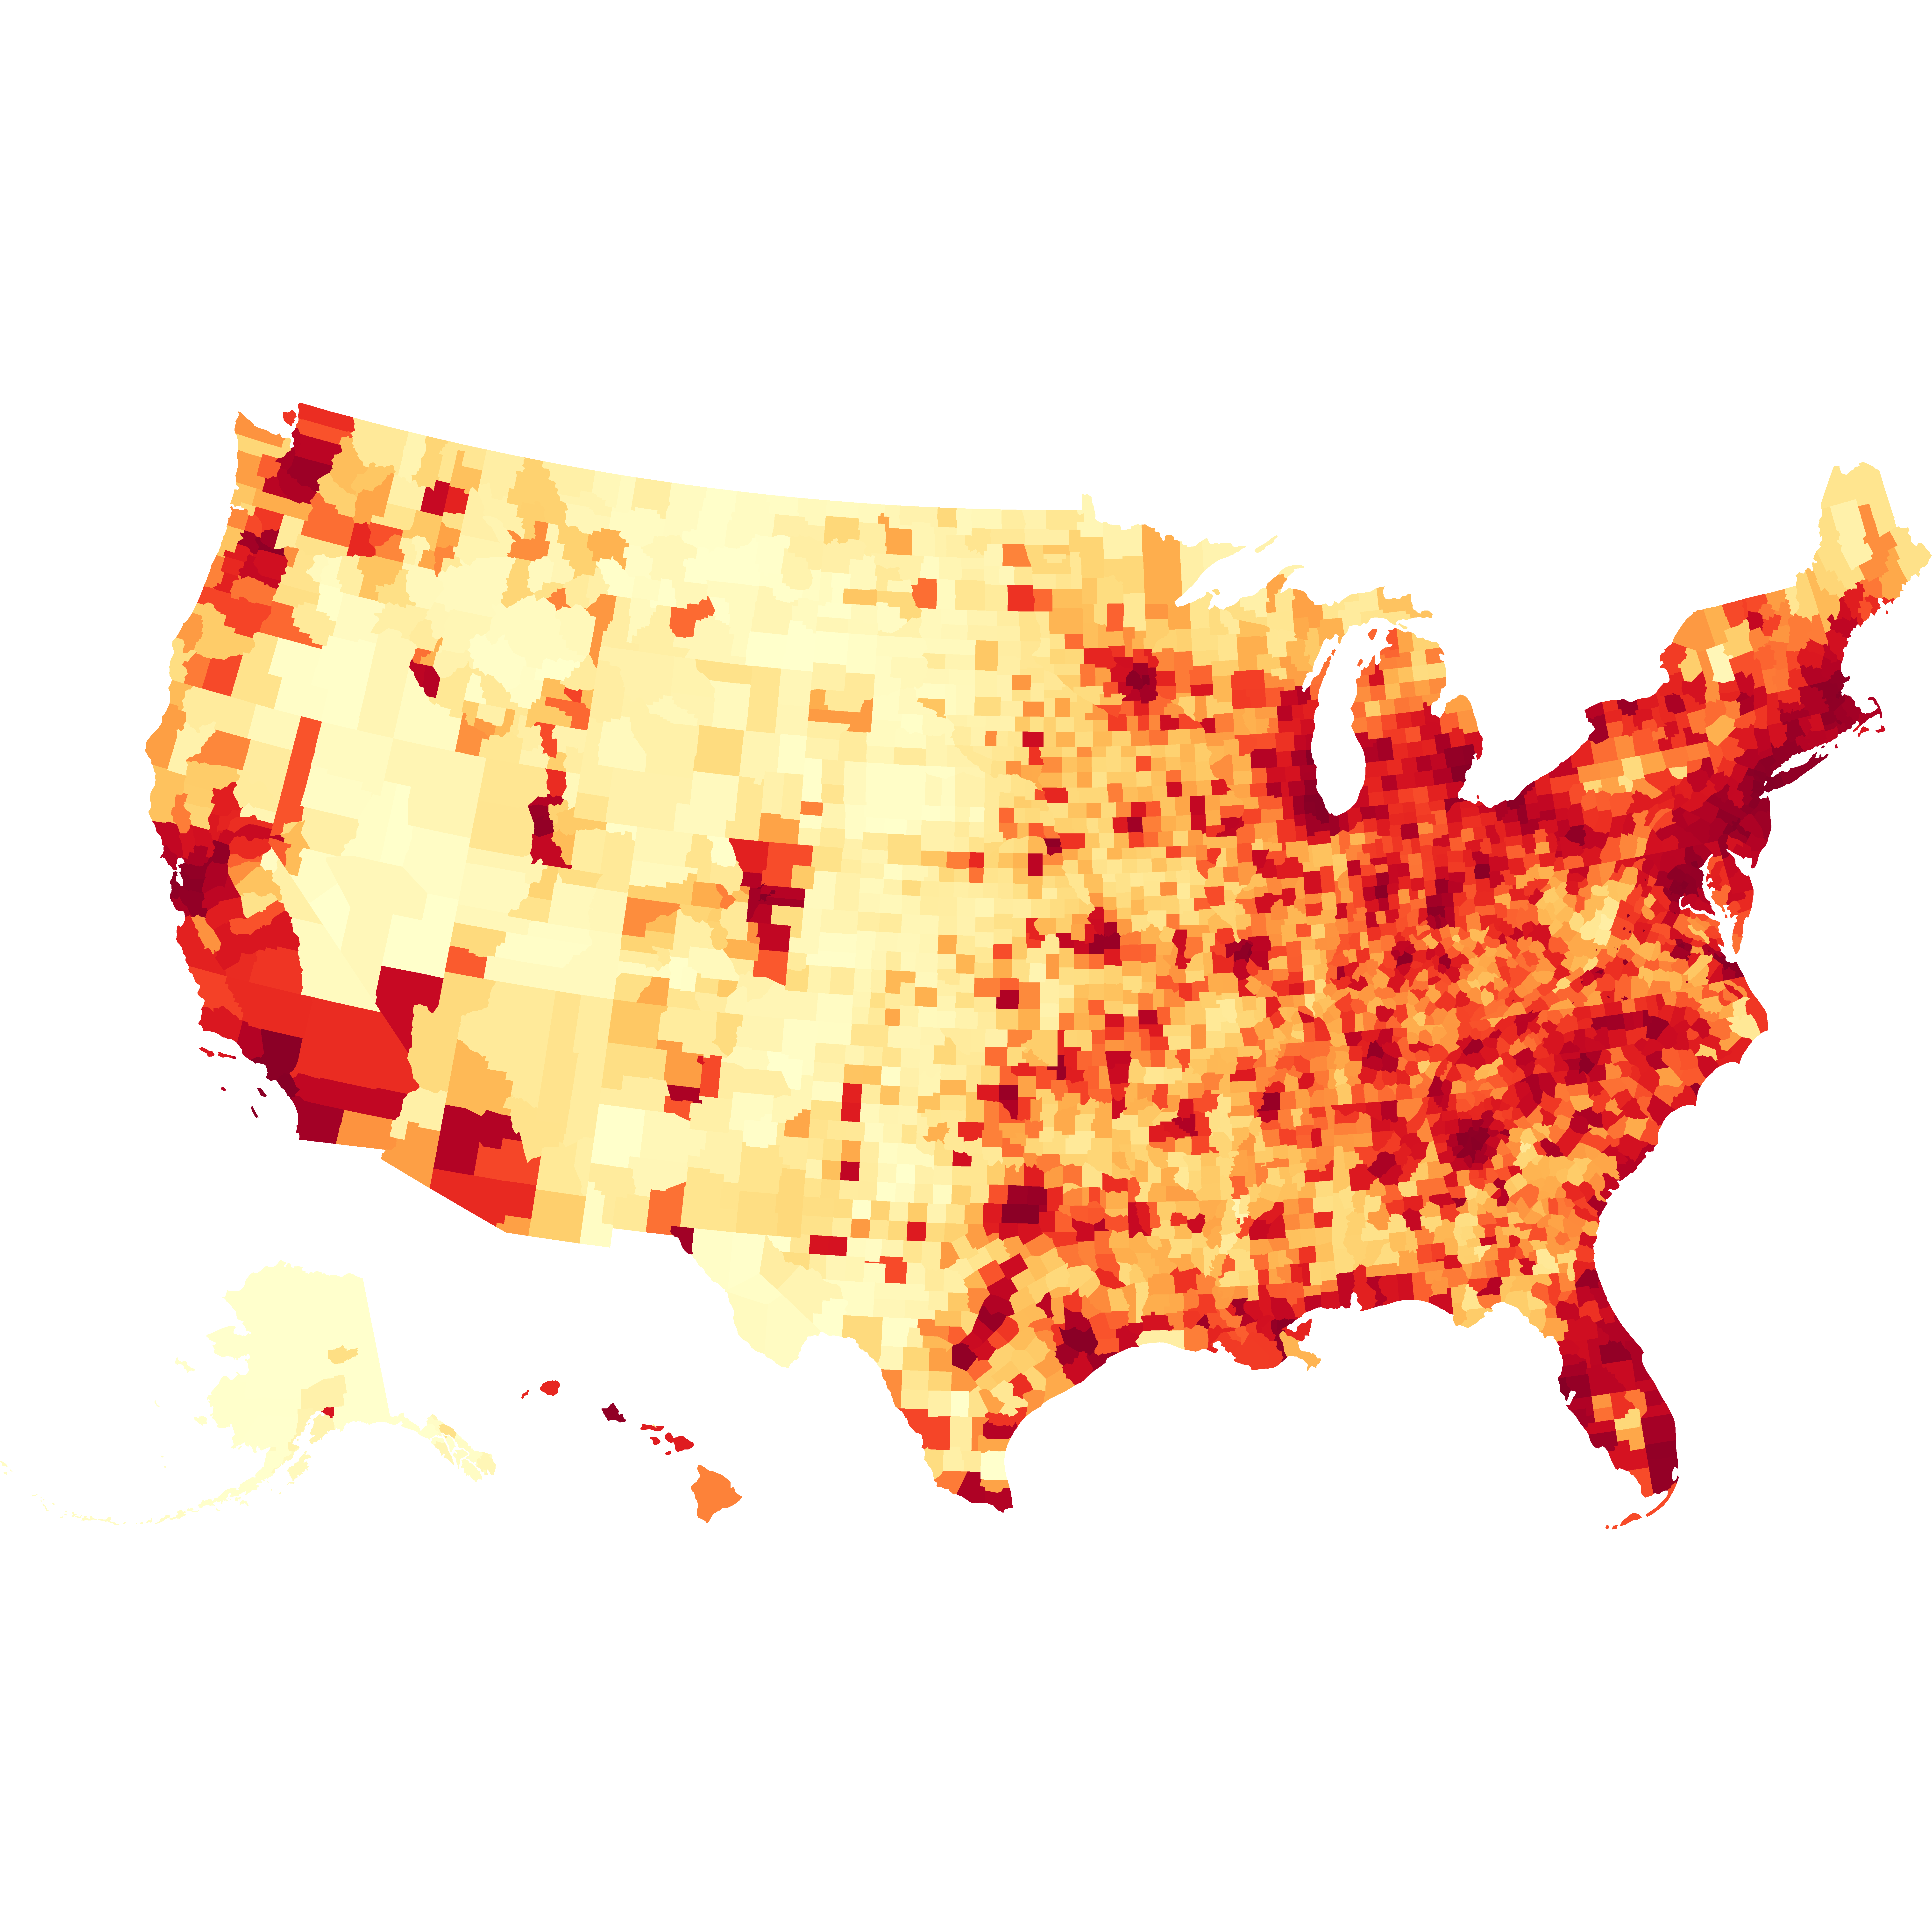
ndjson-join 'd.GEO_ID' 'd.properties.AFFGEOID' \
  data/census/population/productDownload_2021-04-05T202107/ACSDT5Y2019.B01003_data_with_overlays_2021-04-04T064754.ndjson \
  data/census/cb_2017_us_county_20m/cb_2017_us_county_20m.ndjson \
  | ndjson-map 'd[1].properties.FULL_NAME=d[0].NAME, d[1].properties.POPULATION = +d[0].B01003_001E, d[1]' \
  > data/census/population/county-total-population.ndjson
mkgeo-render-choropleth data/census/population/county-total-population.ndjson \
  -f "d.properties.POPULATION/(d.properties.ALAND*3.861e-7)" \
  -o output/choropleth/county-pop-density
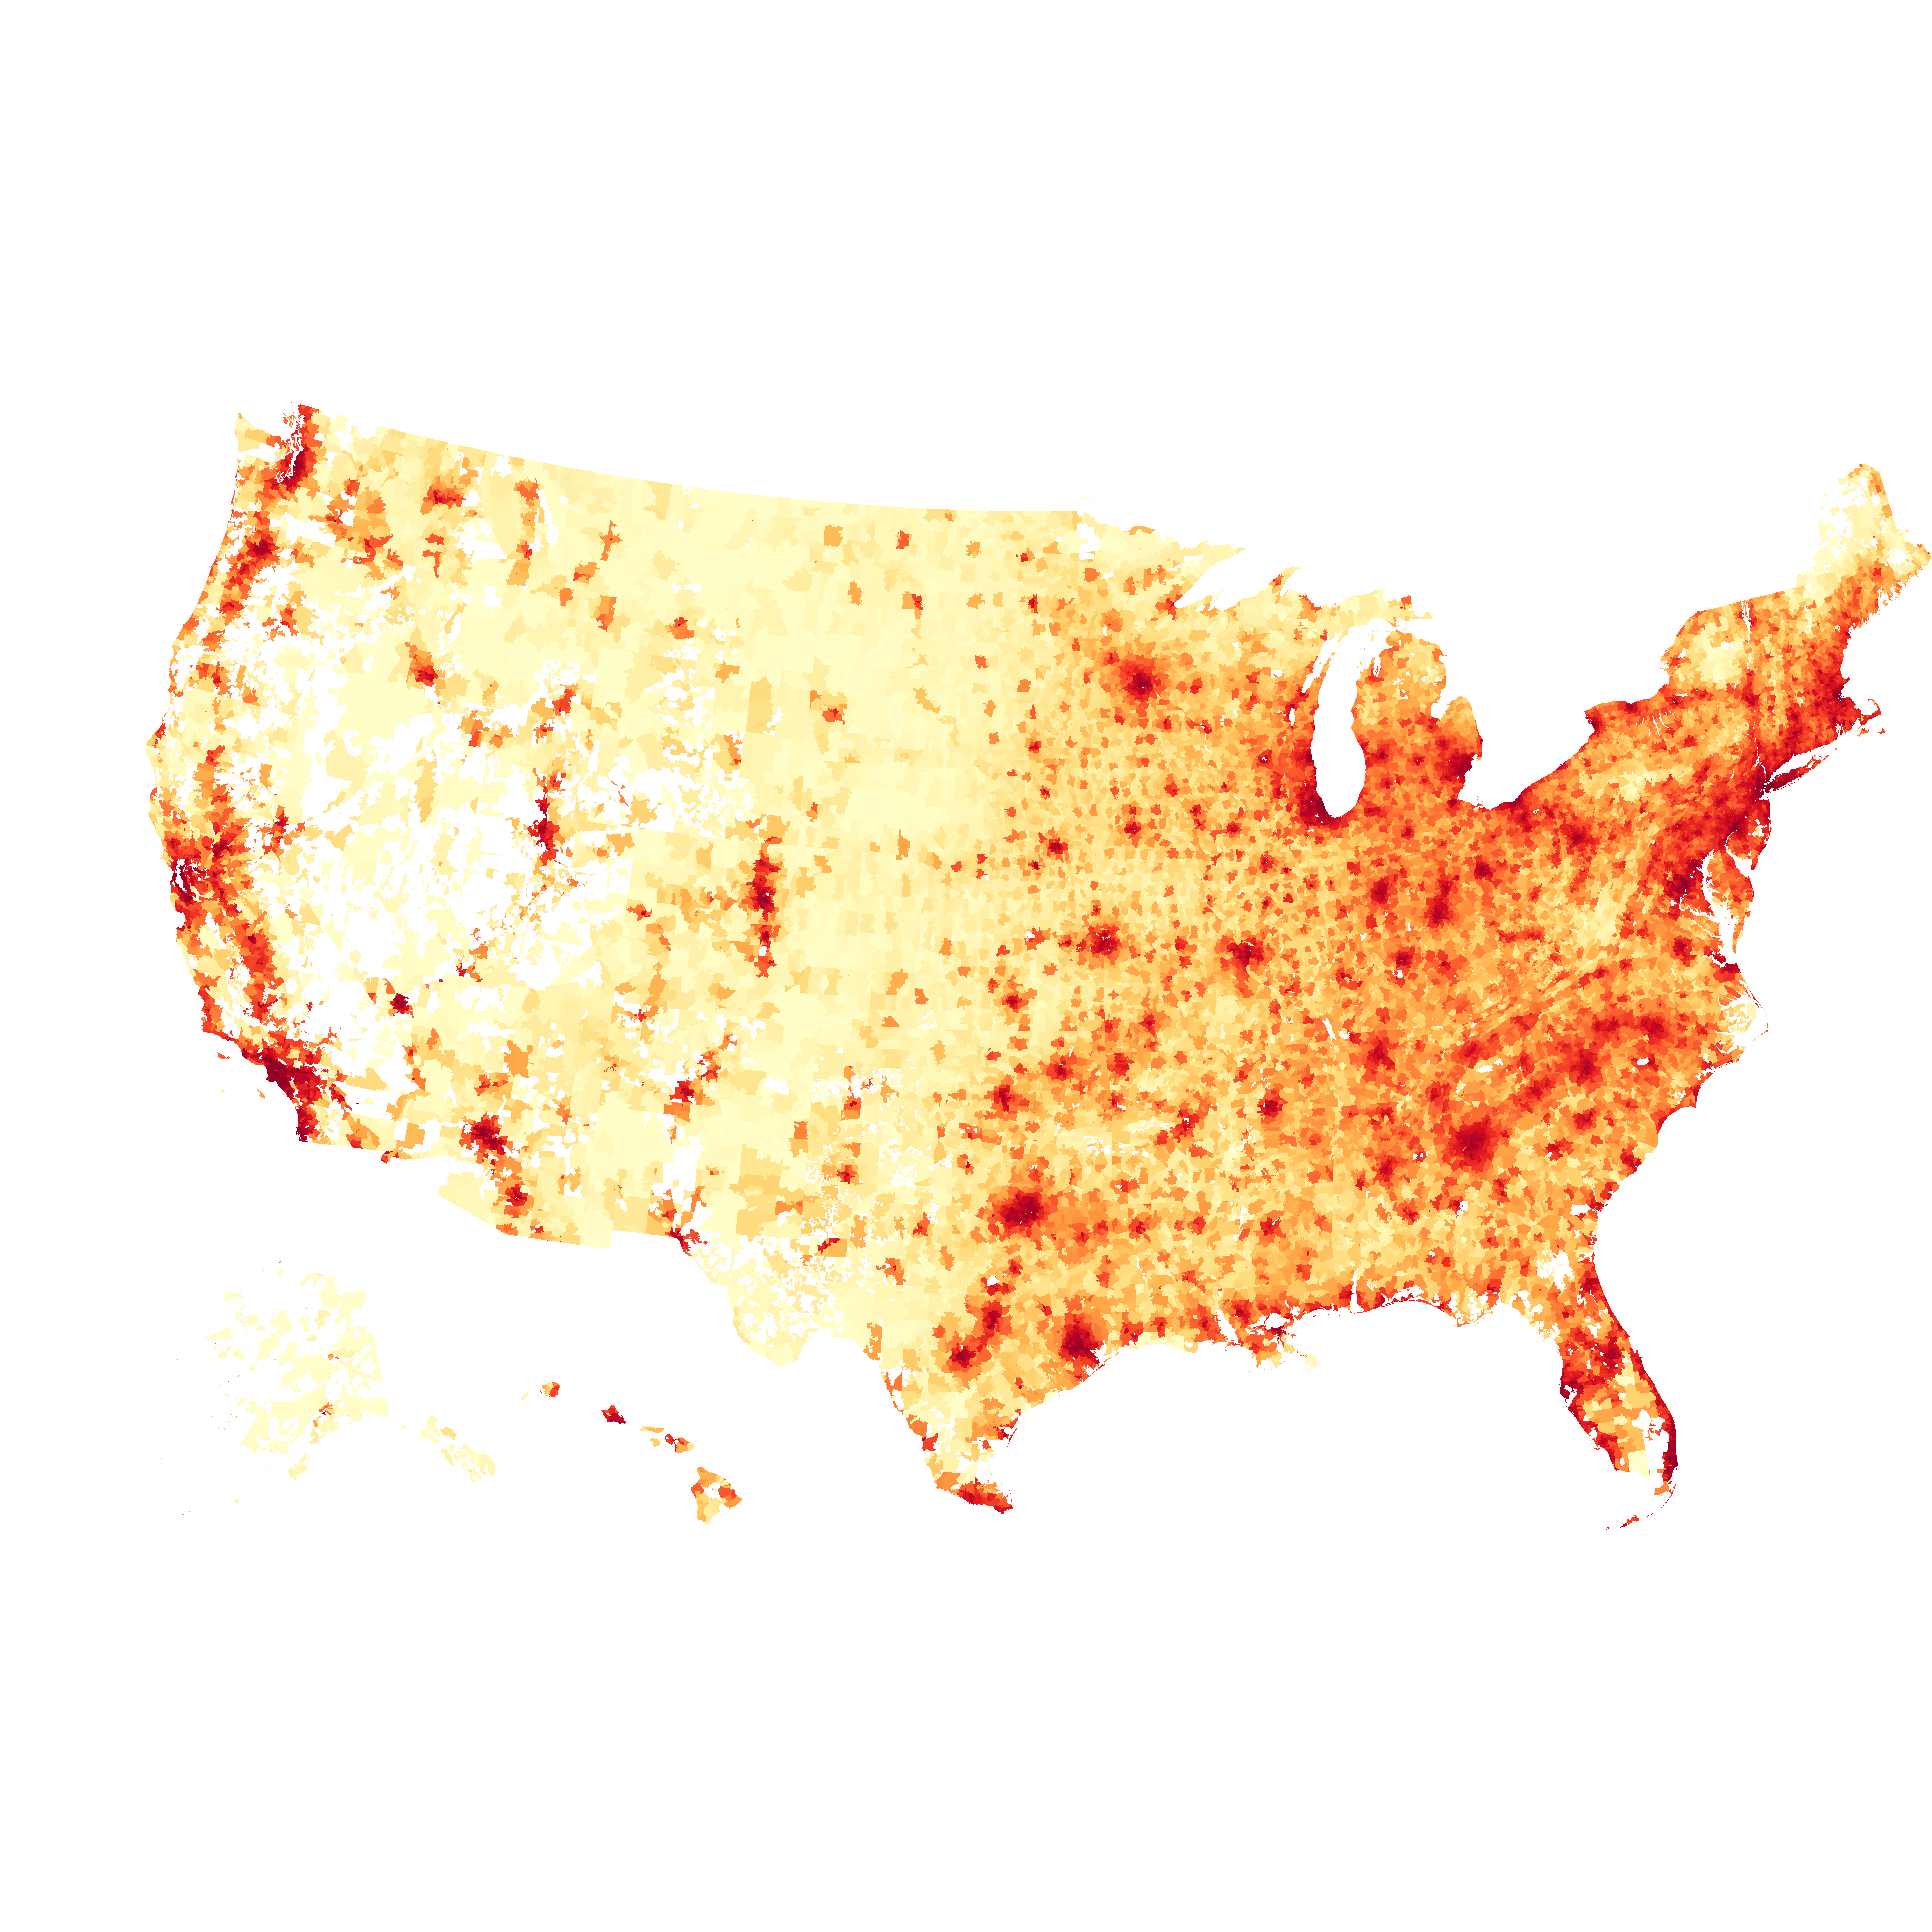
ndjson-join  "d.properties.GEOID10" "d['GEO.id2']" \
  data/ziptemp/states-and-zips.ndjson \
  data/census/population/zip-total-population.ndjson \
  | ndjson-map 'Object.assign(d[0], d[1])' \
  > data/census/zips_with_population.1.ndjson

mkgeo-render-choropleth data/census/zips_with_population.1.ndjson \
  -f "parseFloat(d.HC01_VC03)/(d.properties.ALAND10*3.861e-7)" \
  -o output/choropleth/zip-pop-density